Digital Twin Solutions
Build a real-time virtual copy of your production line with Ono Teknoloji's digital twin solutions and monitor performance live.
The product we use: OnoTwin Studio
See it on screen
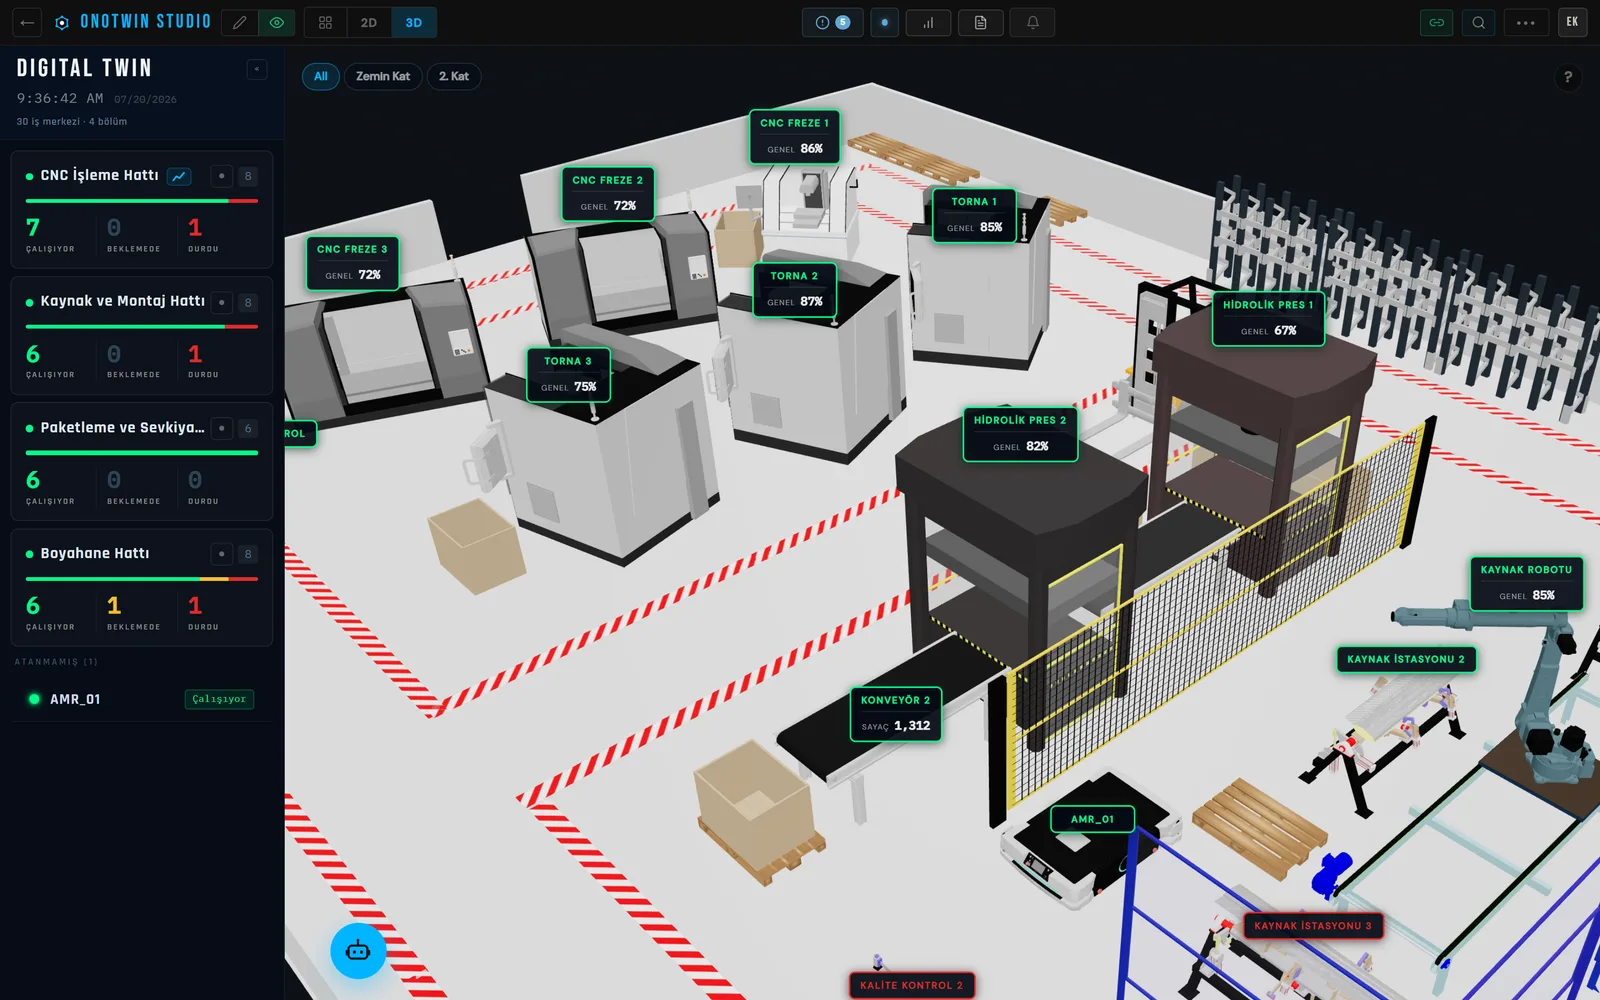
The whole factory on one screen, OEE, section performance, downtime reasons, and the live 3D view together
Digital Twin SolutionsClick a machine and drill in, status, operator, OEE, counter, and cycle time in one panel
Digital Twin SolutionsThe daily briefing speaks in sentences first: which machine sits how far below its own normal, why it stopped, where the shift ends at this pace; the loss beside it
Digital Twin SolutionsOne day, 7 days, 30 days or any two dates: what stopped the line for how long, what share of scheduled time it took, on which machines
Digital Twin SolutionsRewind the shift: wherever the scrubber sits, the labels show that moment, stops pile up under each machine, and the loss is counted up to that minute
Digital Twin SolutionsWe build a virtual copy of the machines, lines, and systems on your production floor, fed by real-time data. Machine status on one screen, production figures on another, alarms on a third, no more: everything comes together in a single, living model of your factory.
The aim is not just watching: it is turning scattered signals into operational intelligence, and making the watching predictive monitoring, a basis for deciding who should look at what, before a problem grows.
How It Works
We connect your floor’s data sources to the OnoTwin Studio platform; your factory becomes a live 2D/3D model in a Windows desktop app:
- A live status and OEE label above every machine in the 3D scene; the layer switch shows one field across the whole factory
- Click a machine and drill in: operator, counter, cycle time, and production progress
- Downtime analysis: today, the last 7 days, the last 30 days or any period; by machine, reason, operator and shift; pick and compare side by side
- Daily and weekly briefings: the machines that need attention in sentences, the stops that deviate from their normal, the estimated loss in currency
- Order forecasts: a finish date at the current pace, stalled orders flagged, the forecasts’ hit rate reported
- Replay: rewind the shift on the floor; Events: the floor’s log, day by day
- Predictive monitoring: risk warnings before the stop happens, with the last 30 days’ hit rate alongside
- The same live view on desktop, tablet, and phone; a presentation mode for the wall screen
To see how predictive monitoring works at the scale of a single machine, try the pump vibration demo in your browser: inject a fault and follow the diagnosis and the measurements behind it. To see where cycle time goes, there is the die-casting cell demo: the cell’s cycle is split into its phases, and the gap is matched with die temperature and cooling-water data. Sometimes the cause sits outside the machine: in the weaving hall demo, a drop in efficiency is costed in metres of fabric, and the advisor traces it to the hall’s humidity and from there to a humidifier line. All three demos run on simulated data.
A digital twin isn’t only for the factory floor. In the MRI suite demo, the exams a hospital loses on hot days are traced to the MRI’s cooling water, and from there to the building’s chiller. In the hotel demo, a changeover day’s guests are simulated at the reception, the buffet and the pool, and a third desk or a second buffet line is tried before the day comes. In the water network demo, a district’s night flow doubles, and the loss is narrowed step by step: by the hydraulic model to one part of the district, by the noise loggers to one stretch of street between two valves. In the hospital demo, the beds, the emergency department, the infusion pumps and the operating rooms are followed live, and beds emptied but not released, idle pumps and a theatre waiting for its patient are found. In the wind farm demo, each turbine’s wind and output and the city’s demand are simulated three days ahead from the weather forecast, and a maintenance stop that falls in the windiest hours is moved to a calm morning when the turbines would hardly turn anyway. In the Ankara water demo, the figures ASKİ, TurkStat and the Court of Accounts publish come together in one model: the dams as their inflows fell in 2025 and rose in 2026, the water sent to the city and where it goes; what the dams would have held with fewer losses is found by replaying the two years. The Ankara demo runs on public data, the others on simulated data; if you’d like to talk about your own facility, write to us.
Project Scope
We deliver your digital twin turnkey:
- Discovery: mapping the lines, machines, and data sources
- Integration: PLC, OPC-UA, MES, ERP, MQTT, and SQL; no extra hardware on top of your existing infrastructure
- Modelling: building your factory’s 2D plan and 3D scene
- Commissioning: half-day setup, and getting your team fluent on the board
Integrations
A digital twin is not a screen that stands alone; it is a layer that talks to your enterprise systems:
- Production management: integration with MES and ERP systems, SAP ME/MII first among them
- Equipment management systems: connecting maintenance and asset data into the model
- Third-party applications: live access to HSE systems, machine vision and Grafana dashboards through the model
- Bidirectional connection: not just reading, but sending data back to the shop floor through the platform
Who It’s For
Anywhere with data. Automotive, appliances, textiles, or general manufacturing, any factory whose machines produce data can stand up its digital twin without extra hardware investment.
Related Product
At the heart of this solution is OnoTwin Studio, live 3D monitoring, daily and weekly briefing cards, and AI-assisted reports come from the platform itself; we handle installation and integration as part of the project.