
Predictive Maintenance
See the fault before it becomes a stop: risk warnings from production data, diagnosis from vibration and temperature signals. Every warning is scored.
The product we use: OnoTwin Studio
 Start the demo
Loading the demo…
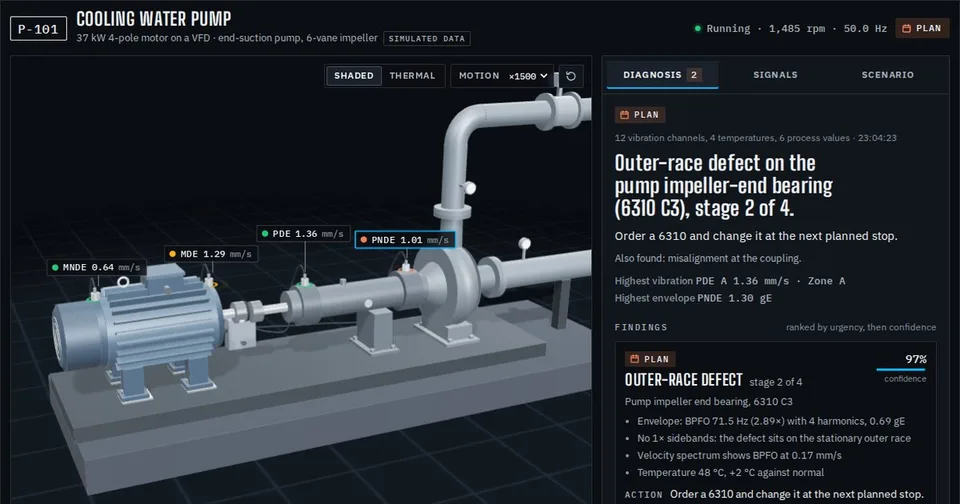
Cooling water pump
37 kW 4-pole motor on a VFD · end-suction pump, 6-vane impeller Simulated data
Findings
Components
Measurement points
| Point | H | V | A | Env | Temp |
|---|
Velocity in mm/s RMS, 10–1000 Hz. Zones per ISO 20816-3, group 2, rigid foundation: A/B 1.4 · B/C 2.8 · C/D 4.5. Envelope in gE, alert 0.8 · alarm 2.0. Temperature alert 75 °C.
Velocity spectrum
Largest peaks click a row to put the cursor on it
Inject faults severity 0–100 %
Operating point
Frequencies move with speed. Switch the spectrum to orders to keep them lined up.
Simulation
A blind test injects a hidden fault. Read the signals, make your call, then reveal it and compare with the engine.
See it on screen
The daily briefing says where things are heading: which machine sits below its own normal, where the shift ends against its target at this pace
Predictive MaintenanceEvery forecast is recorded and scored once the outcome is known; the hit rate sits beside the forecasts
Predictive MaintenanceA machine usually gives notice before it stops. The cycle time stretches, the same stop comes back more often, a bearing’s vibration changes. Those signs sit in the data; but nobody can look at every signal of every machine every day. In predictive maintenance our job is to watch those signs and say so before the stop, with the reason.
Two Sources of Data
Production data, no extra sensors. OnoTwin Studio measures every machine against its own history: how far the cycle time has crept above plan, how often the same stop reason comes back, where the shift ends against its target at this pace. Risk warnings arrive in the daily briefing and the morning e-mail, the most urgent first.
Machine signals, per equipment. Where vibration, temperature, current or pressure is measured, the diagnosis goes one step further: which part, which fault type, at which stage. The rules are tuned to the machine type, its bearing dimensions and its operating conditions. If the measurement already exists we take its data; if not, we work out together what needs measuring and where.
What Is in a Warning
- Which machine, which finding, and the measurement it rests on
- Urgency: the most urgent first
- What it costs: the estimated loss, and how far below target the shift ends at this pace
- Where signals are measured, the recommended action: what to check, which part to have ready
A warning system has to be sparing and sure. One that reports every deviation becomes, by the second week, one nobody looks at; so thresholds are set against each machine’s own normal, and only a deviation that matters comes forward.
The Hit Rate Is Measured
A system that predicts should also say how often it was right. Every risk warning and every order forecast is recorded, and scored once the outcome is known: did it hold or not. The last 30 days’ hit rate sits under the briefing as a single sentence. You decide how far to trust a warning by looking at the record.
Try It in the Demo
To see how it works on a single machine, try the pump vibration demo: inject a fault and follow the diagnosis and the measurements behind it. The machine, the faults and the signals in the demo are simulated; in a real installation the rules are tuned to your equipment.
How We Start
- The machine list and the data at hand. Which equipment is critical, which signal comes from which machine, where the stop records are kept.
- Working out the normal. Each machine’s own normal: the same shift, the recent weeks.
- Switching the warnings on. Few and sure at first. Thresholds are tuned with feedback from the floor.
- Scoring. Which warning held and which did not; the record builds up, and trust follows it.
Who It’s For
For plants that know what an unplanned stop costs but still maintain by the calendar or by the breakdown. It is easiest to start on lines where the critical equipment is known and a stop is expensive.
Related Product
Risk warnings, the daily briefing and the hit-rate record are part of the OnoTwin Studio platform; for the live-monitoring side see Digital Twin Solutions.