
Four Builds of the Same Line: From 53 to 161 Parts an Hour
The hardest part of an investment decision is that you cannot try the alternative. In simulation you can: we ran the same line in four builds, and each one reported a different number.
The hardest part of an investment decision is that you cannot try the alternative. Once the line is built, there is no “let’s also try it the other way”; after the steel is cut, every change costs money and downtime.
In simulation you can try it. We modelled one production line in four different configurations and ran each under identical conditions. The model stays the same: raw material racking, machining cells, assembly stations, and the outbound conveyor. The only thing that changes is how the work is divided between people, robots, and material handling.
Four builds, four measured results. The numbers are not estimates; each was read off the simulation’s own shift run.
Build 1: The eight-operator manual line
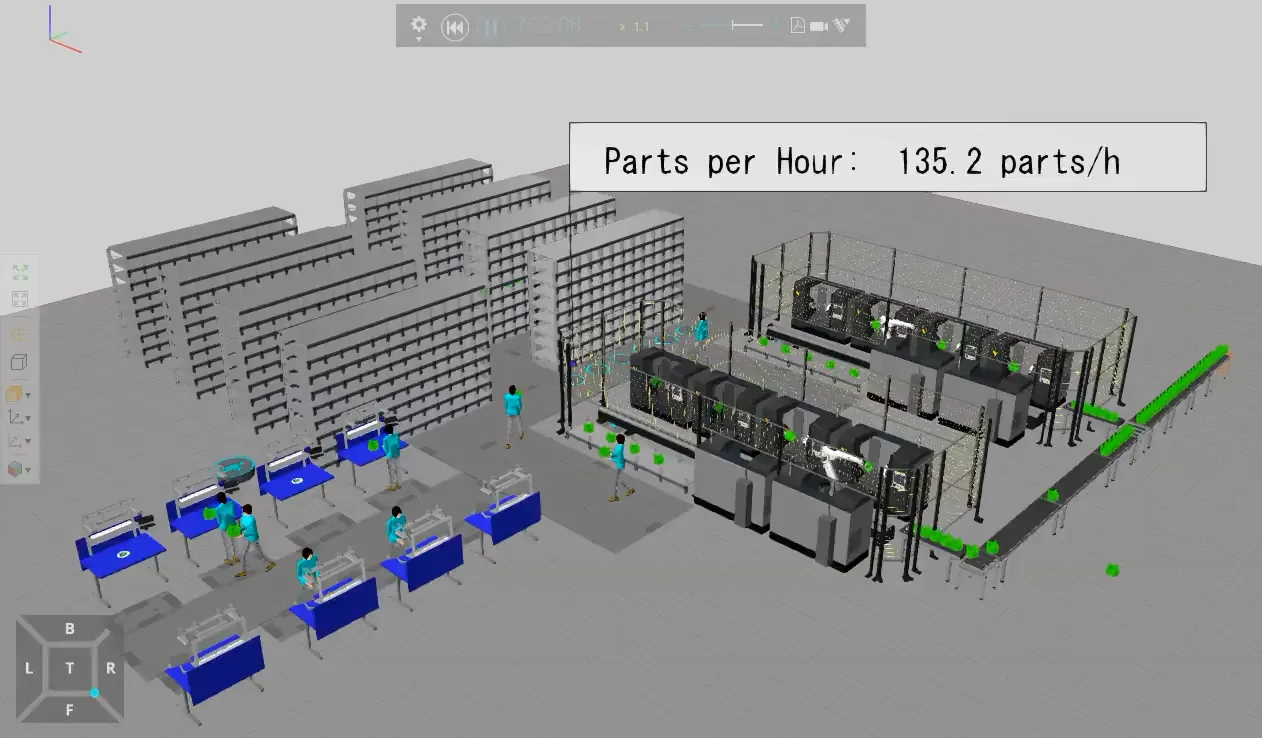
The starting point: assembly is fully manual, eight operators each work their own bench, material moves by hand.
Result: 135.2 parts per hour. This is the line’s reference value. With a large crew, stations are rarely starved; but the output carries a real cost, and a share of every operator’s time goes to walking and carrying rather than producing.
Build 2: Two operators, distanced layout
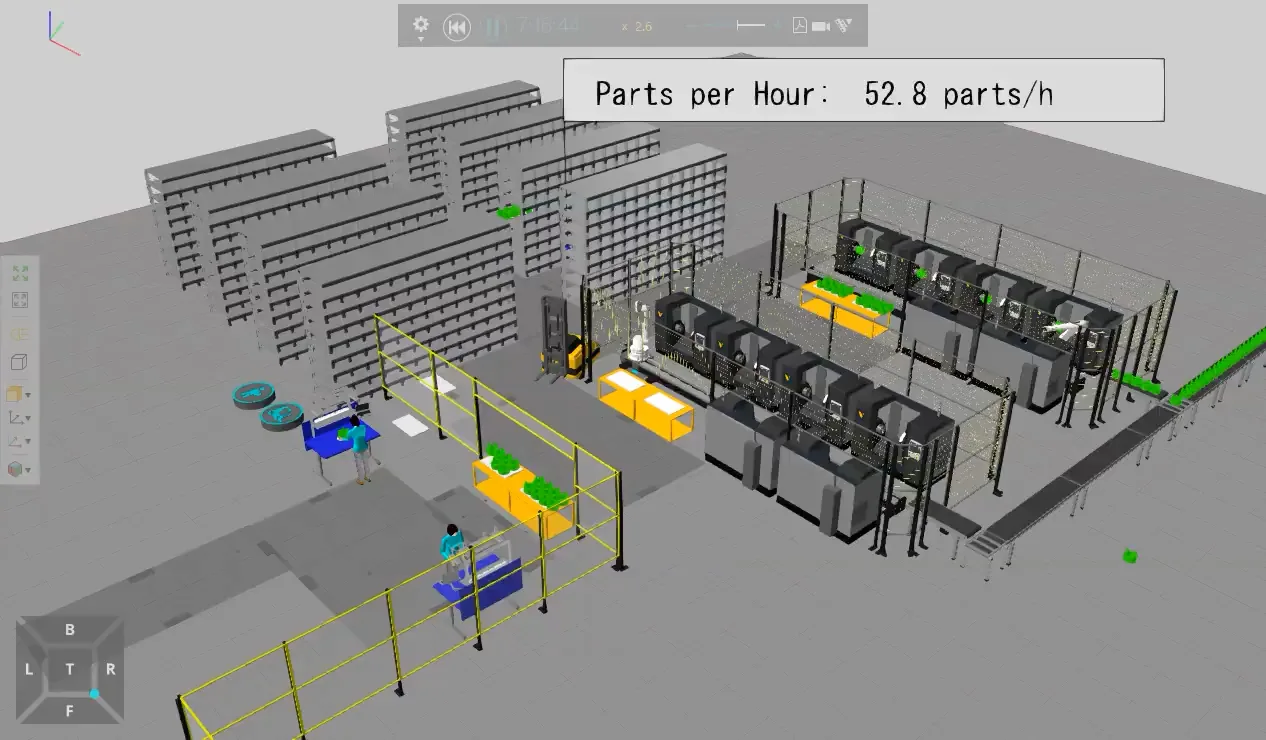
The real question of the pandemic years: cut the crew from eight to two and keep them apart, and what does the line produce?
Result: 52.8 parts per hour. Output fell 61 percent; but note the crew shrank by 75 percent. Productivity per person actually rose. The problem is that two people cannot be everywhere at once: stations wait for an operator, machines sit idle.
Build 3: Two operators, two cobots
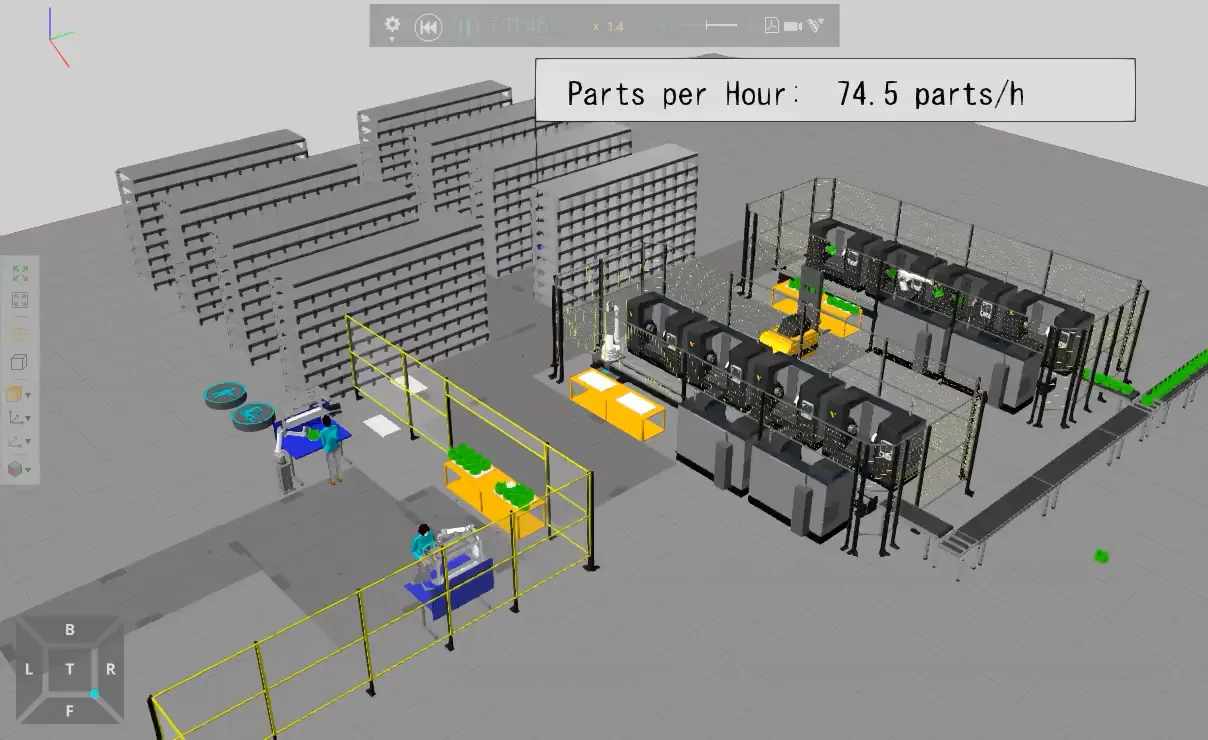
Same two-person crew, plus two collaborative robots. The cobots take the repetitive share of assembly; the operators focus on feeding and inspection.
Result: 74.5 parts per hour. A 41 percent gain over the two-operator build without growing the crew. The cobot payback calculation stops being an assumption: 21.7 extra parts an hour, multiplied by profit per part, divided by the investment.
Build 4: The AGV layout, six operators
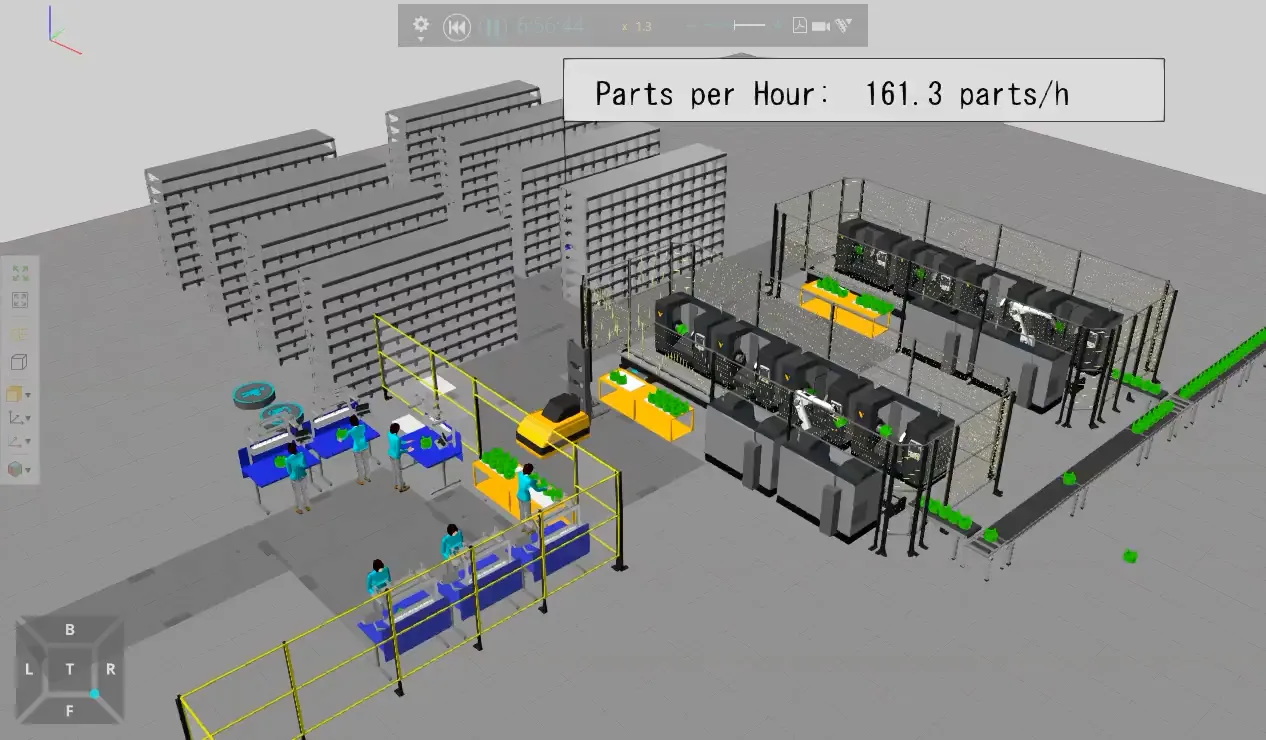
In the final build we took transport away from people entirely: an AGV carries the material, and six operators do only value-adding work.
Result: 161.3 parts per hour. That is 19 percent more than the eight-person reference layout, with two fewer people. The source of the gain is plain: with walking and manual carry gone, the time stations spent waiting to be fed melted away.
What the table says
| Build | Operators | Output (parts/h) | vs. reference |
|---|---|---|---|
| Manual line | 8 | 135.2 | reference |
| Distanced | 2 | 52.8 | down 61% |
| Cobot-assisted | 2 | 74.5 | down 45% |
| AGV layout | 6 | 161.3 | up 19% |
The real lesson is not the numbers themselves. Same line, same product, same machines; only the division of work changed, and output moved across a threefold range. Which build is “right” depends not on the line but on your question: are you constrained on headcount, chasing a capacity target, or defending an investment budget?
One caution belongs here: these are this model’s numbers. On your line a cobot behaves differently, an AGV behaves differently; your cycle times, product mix and layout decide. That is exactly why simulating your own line beats trusting a general percentage.
For your own line
We answer questions like these in two ways today. With Visual Components we run detailed engineering studies, and with ONO SIM we build your line, run the shift, and report the result in cost per part and payback. We build the simulation; you decide on the results. The details are on the engineering consultancy page.
Write to us with the question on your mind from the contact page, and we’ll work out together which builds are worth testing.